 landing.fyi
Features
Everything in one upload
The home page is the tour — this is the detail: how the score is actually measured, what the landing.fyi review looks at, how to compare your landings, and where they live.
Scoring
A score you can trust — and break apart
The overall is a softened weakest-link of six sub-scores — your worst dimension leads the number, so one bad moment can't hide behind four good ones. Each dimension is measured the robust way, not the flashy way:
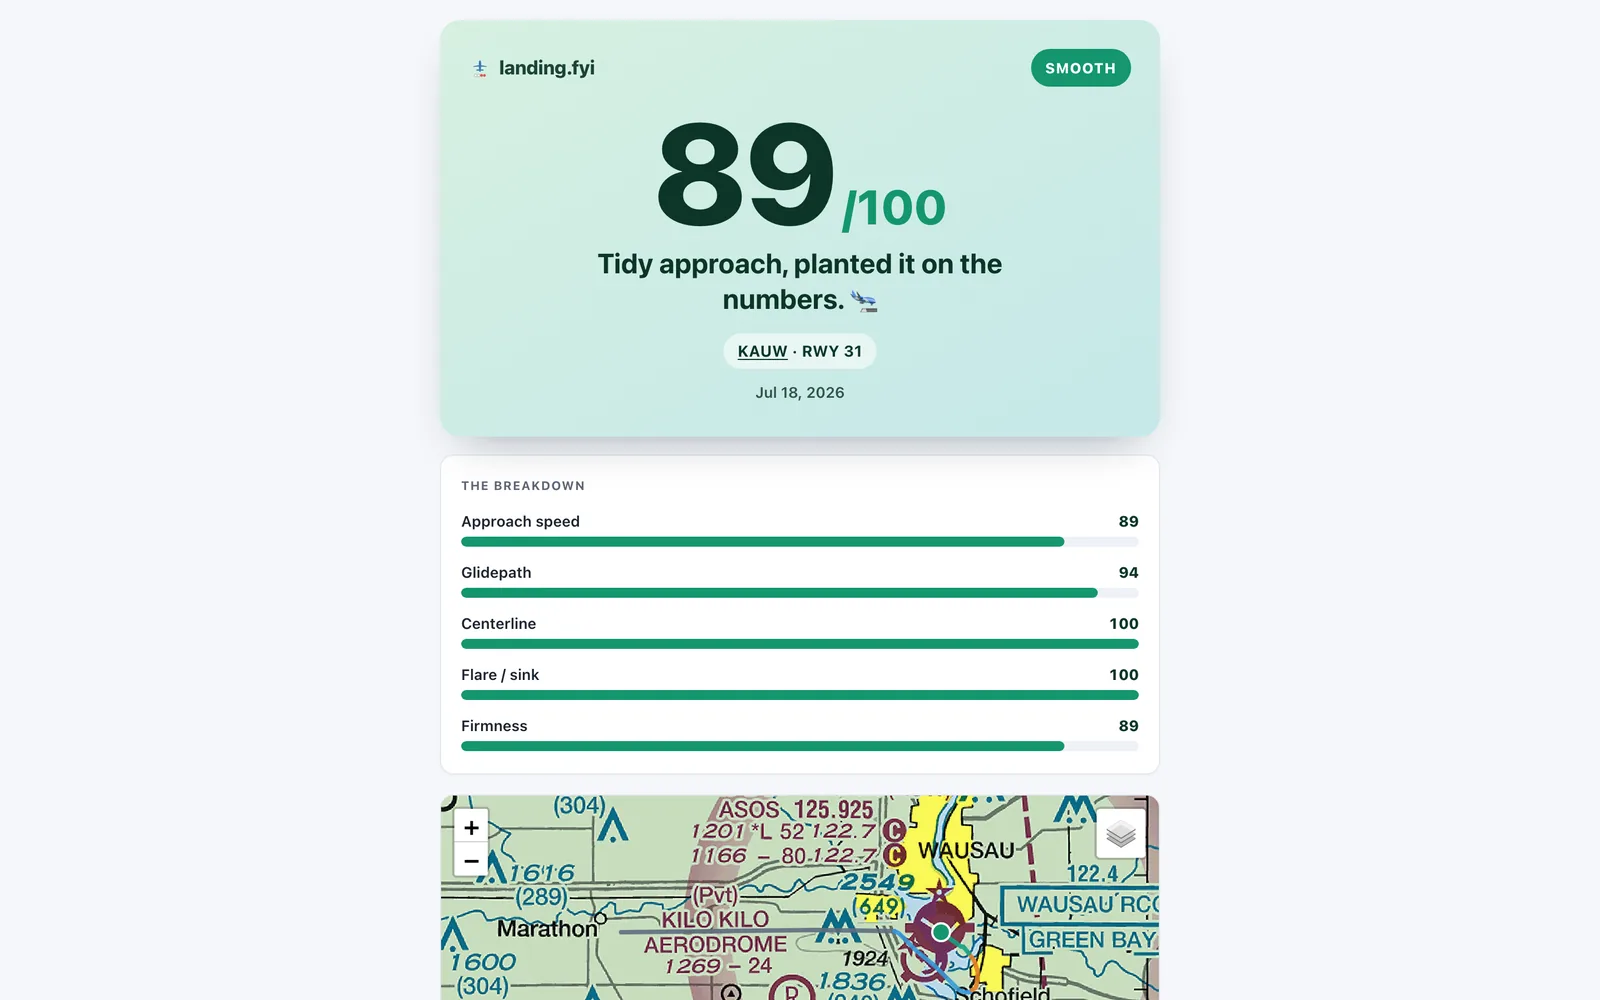
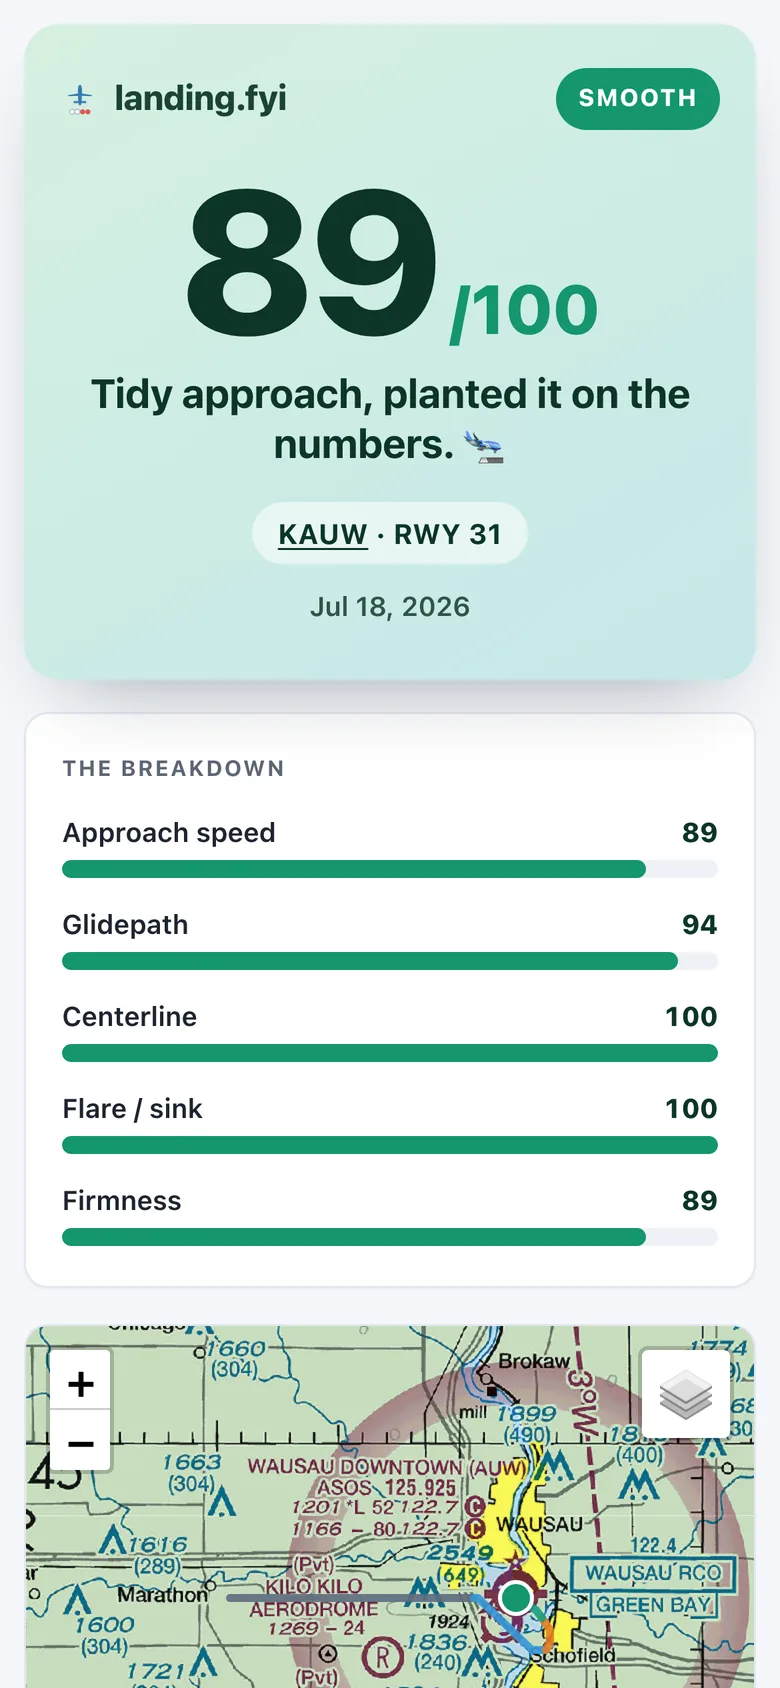
Approach speed
Graded against your own deceleration trend, so a smooth, intentional bleed-off scores clean — only wander and excursions cost.
Glidepath
Graded over the settled final: an early correction that settles is forgiven, an approach that never settles is not.
Centerline
A trend over the last seconds of final, not one GPS fix — so a single noisy sample can neither fake it nor ruin it.
Flare / sink
Read at the instant of contact, after the flare has done its work — the number that separates a kiss from an arrival.
Firmness
The raw peak, straight off the accelerometer — the same jolt your passengers grade you on.
Rollout
Measured from your own track in the runway's own frame, so it works at any field: a wander you correct still counts, a clean rollout scores full.
No guessed scores
If too little of your landing can be measured from your log, there's no overall at all — never a made-up number.
Low confidence, labeled
Ambiguous data gets flagged and kept out of your stats and the leaderboards, instead of quietly counted.
Consistent across devices
The same landing logged by two different devices scores within a couple of points — the number is built to be trusted.
The review
A review that reads what an instructor watches
Every scored landing can be opened into the landing.fyi review — a short written read. It works from measurements, not vibes — and it decides what was the air and what was you before it says a word:
- The wind's workload — gust swings, crosswind and tailwind demand on final.
- Air or pilot — a thermal bump and a chased glidepath look different in the data, and get treated differently.
- The approach shape — stabilized by 300 ft, the flare, crab versus wing-low, how you held centerline.
A gusty final gets credited, not blamed on you. A calm-day wobble gets coached, kindly and specifically.
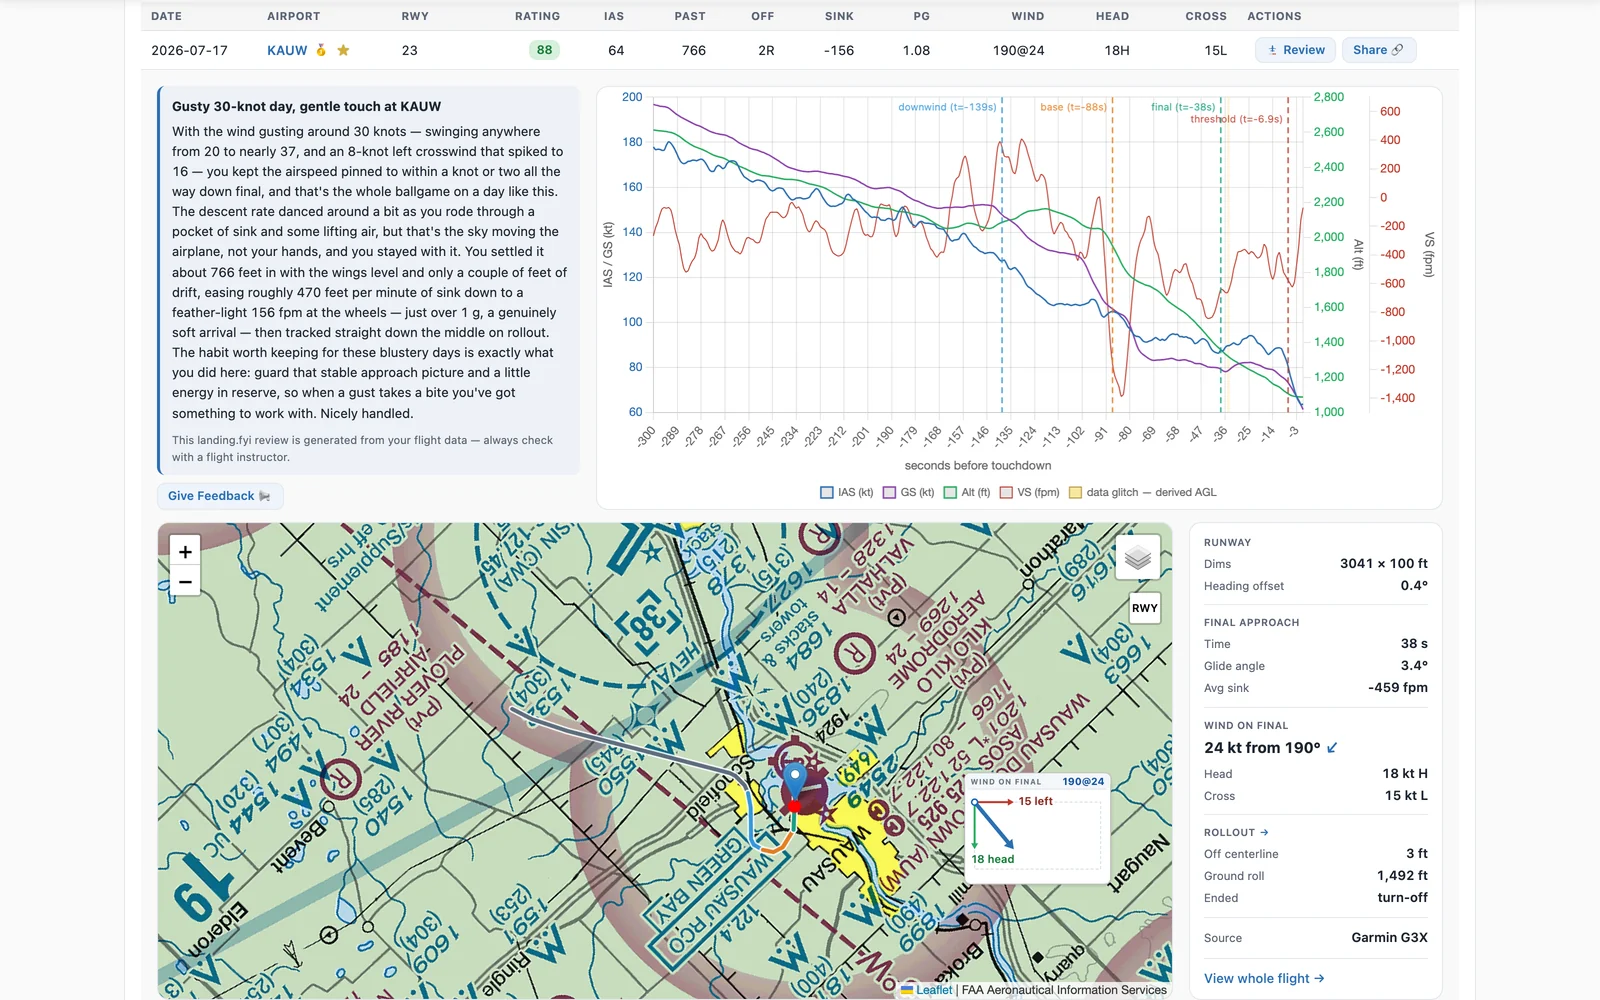
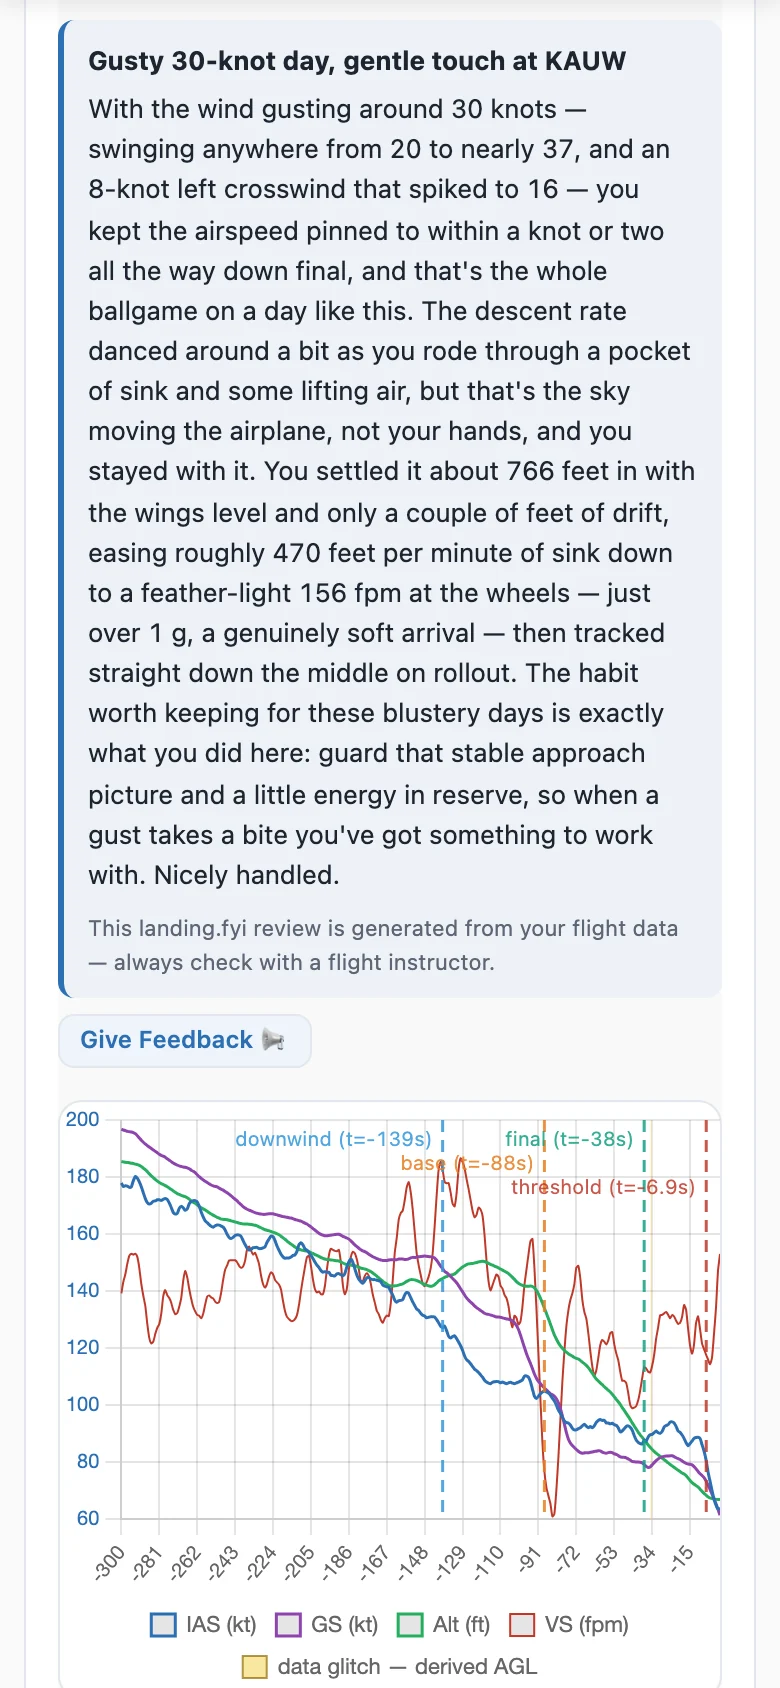
“With the wind gusting around 30 knots … and an 8-knot left crosswind that spiked to 16 — you kept the airspeed pinned to within a knot or two all the way down final, and that’s the whole ballgame on a day like this. … easing roughly 470 fpm of sink down to a feather-light 156 fpm at the wheels, just over 1 g, a genuinely soft arrival — then tracked straight down the middle on rollout.”
Overall score over a season
Progress
Watch yourself get better
The dashboard is built to show improvement, not just the last flight. A single landing index sums up how you're flying right now, streaks reward the runs you string together, and every part of the score has its own trend.
- Your landing index — the average of your best 8 of your last 20 landings, golf-handicap style: one number to move, steady against a single rough day.
- Streaks — landings in a row scored 80 or better, and in a row without a bounce, counted in landings so time off never breaks them.
- Best-ever, called out — when a touchdown is your best score yet, or your best at a field, the card says so.
- Sub-score trends — each part of the score charted over time, so you know which skill is actually improving.
- A monthly recap — a shareable month-in-review of your landings, airports, bests and signature moments, emailed a week into the next month.
Compare
Your landings, side by side
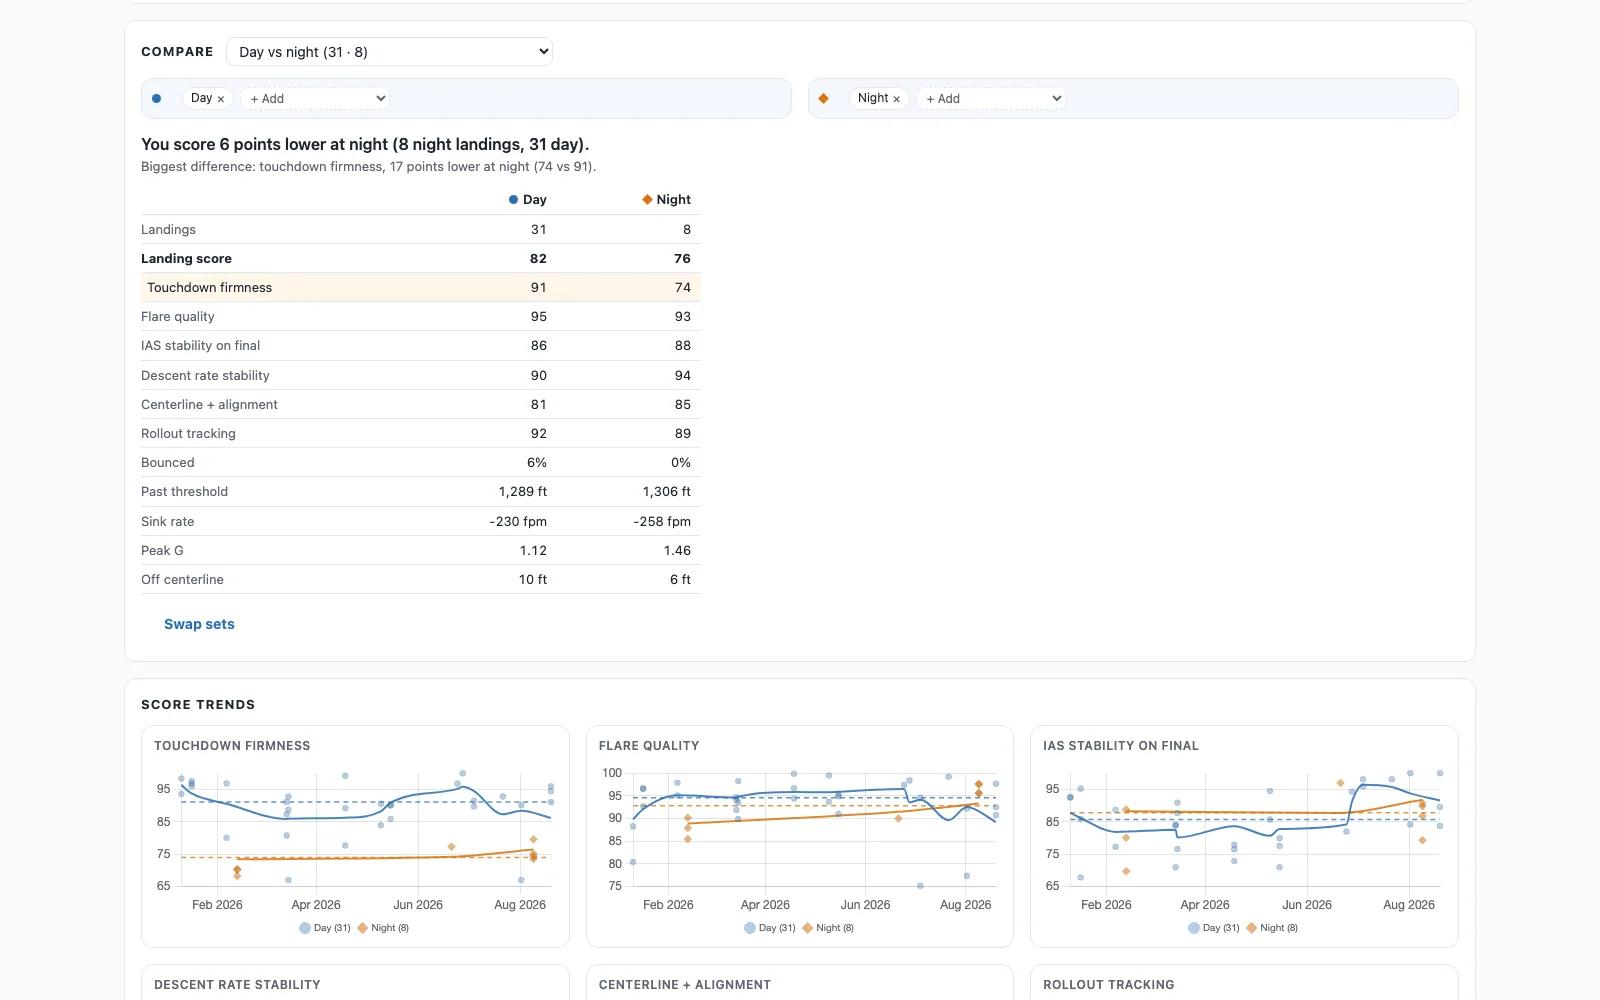
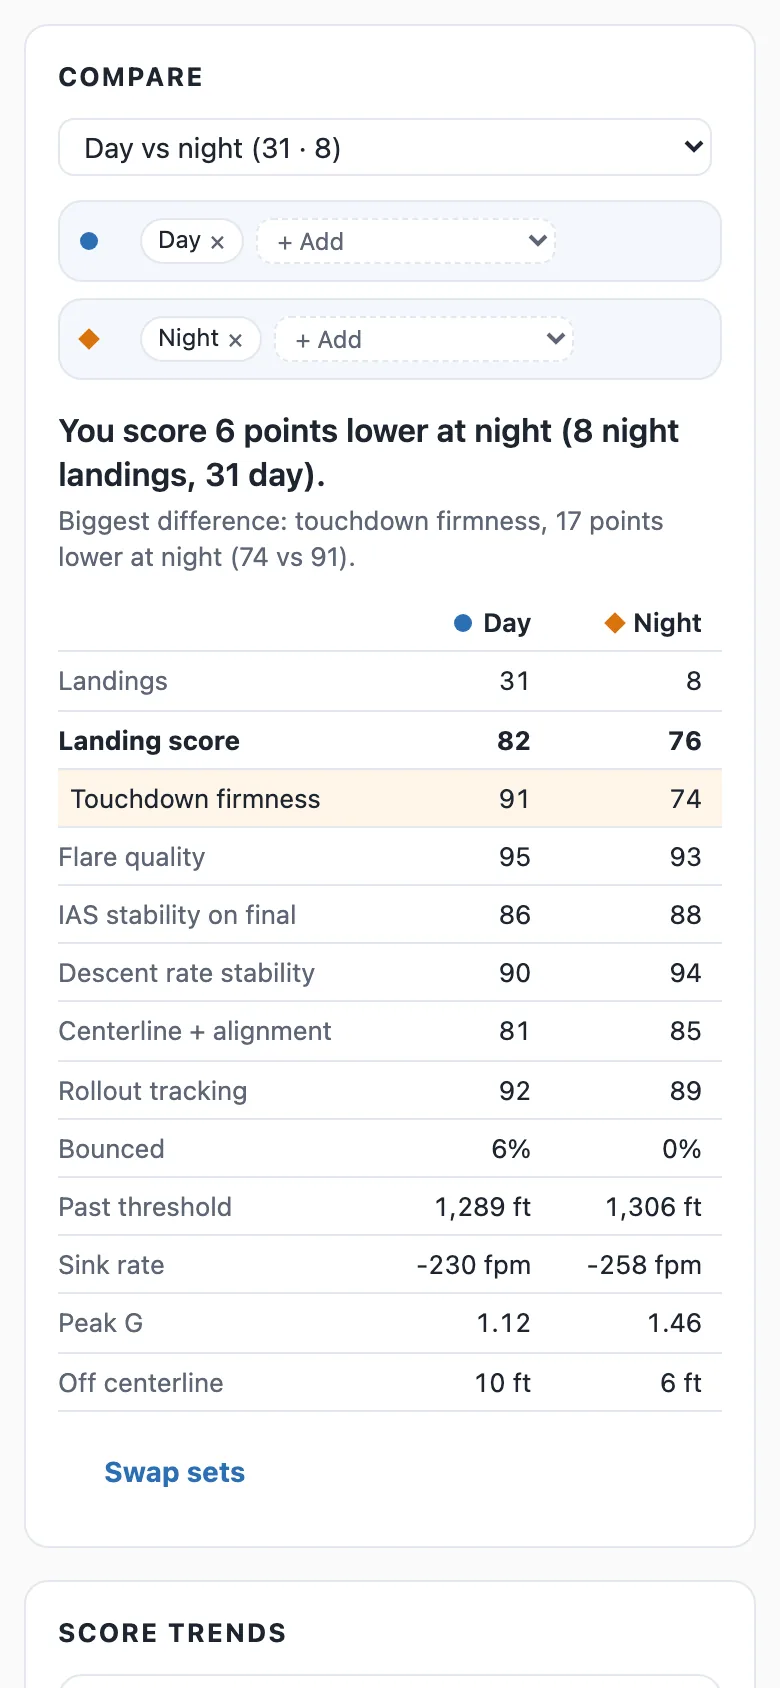
Pick two sets of landings and the dashboard splits in two: the summary, every trend chart and the landing list show both, with a plain answer on top. Start from a preset or build your own.
- Presets — day or night, steady wind or gusty, a light or 10 kt+ crosswind, morning or afternoon, cool or hot, low or high density altitude, home field or away, long or short runways, low or high fields, a familiar field or a first visit, current or rusty, the first landing of a flight or the ones after, the last three months or before, and your two aircraft if you fly both.
- Your own sets — combine any conditions, airports, years or notable moments on either side.
- The same conditions as filters — narrow the whole dashboard to night landings, gusty days, or landings after time off.
- An honest answer — it compares medians and names the part of the landing that differs most; with fewer than five landings on a side it says “not enough yet”, and low-confidence landings stay out of the numbers.
- Notable moments — every landing is tagged with what made it worth noticing: a greaser, a gust that lifted you back off, a strong crosswind handled, a firm or long touchdown, a night landing. The tags never change your score, and each one works as a filter.
Airports
Your home field has a leaderboard
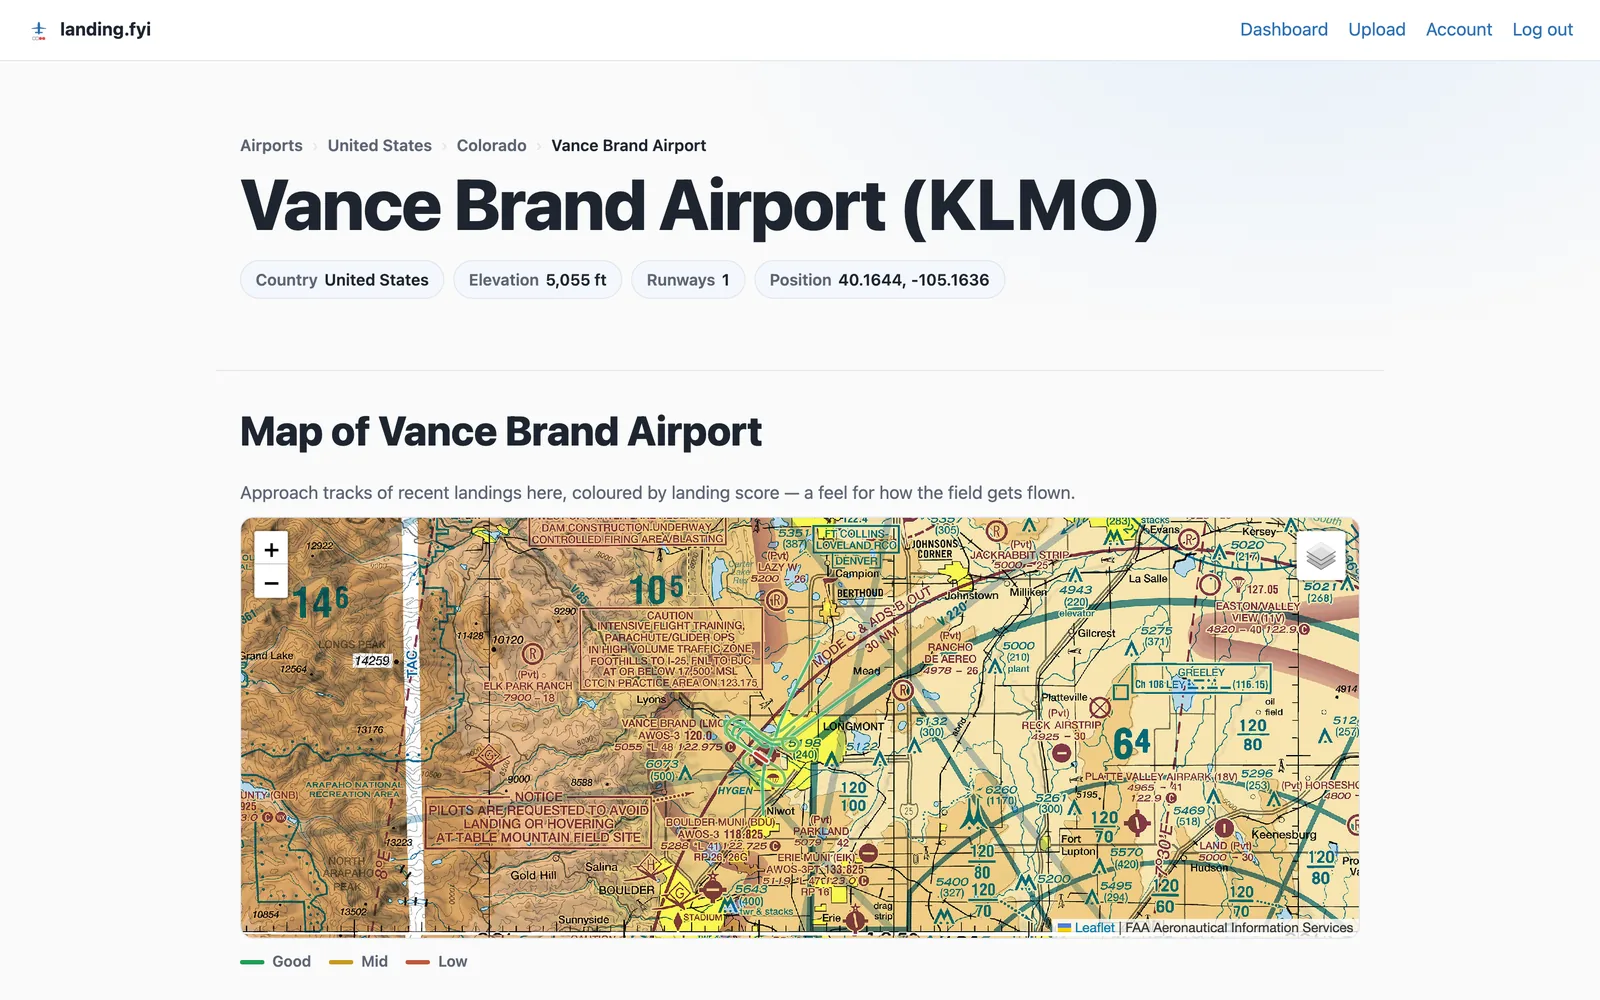
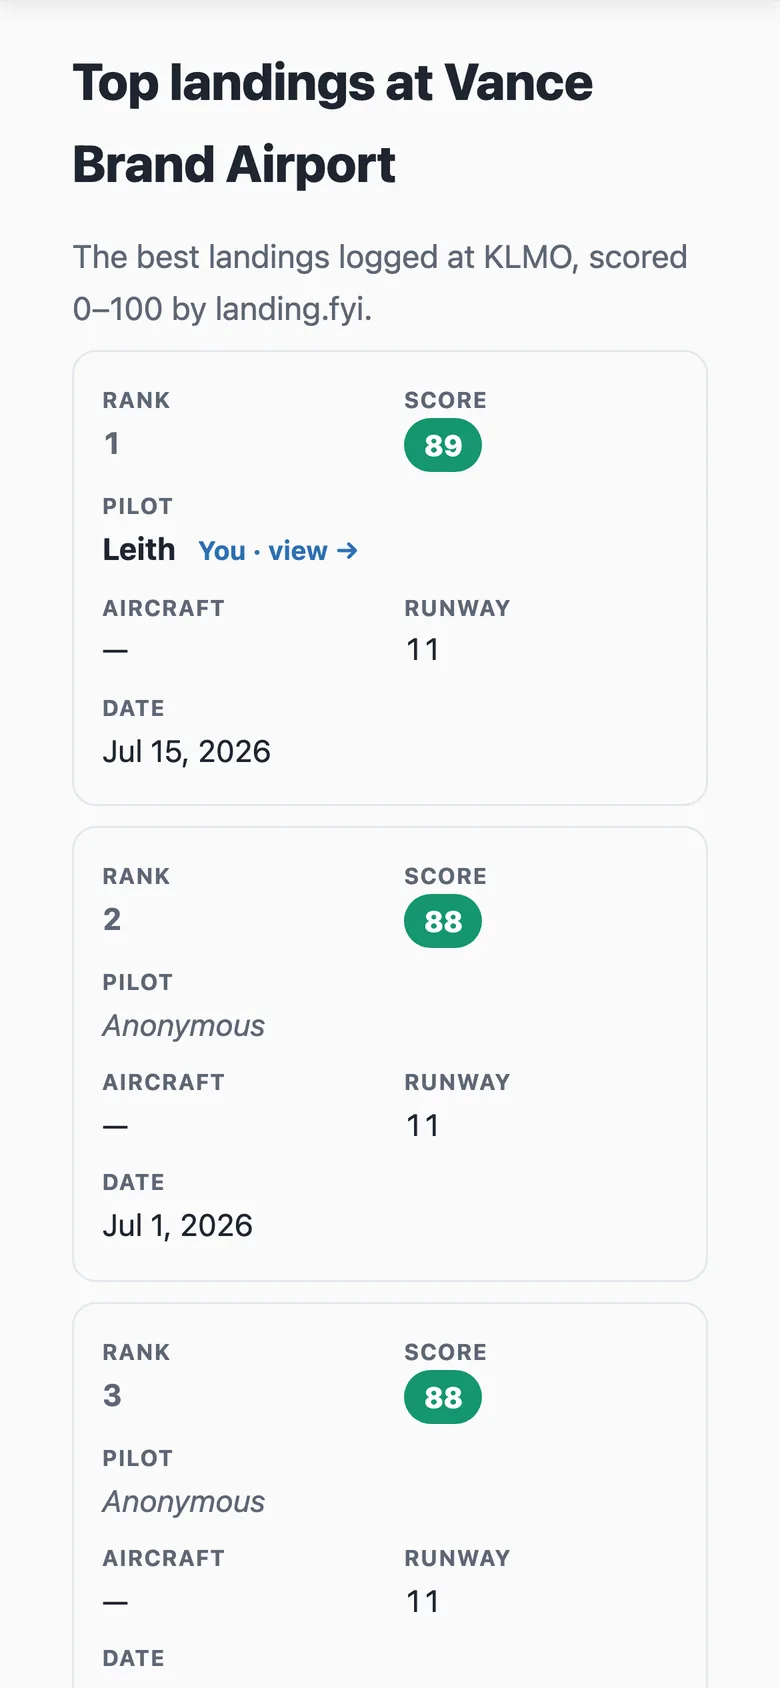
Every airport gets a public page — the field on its aviation chart, recent approaches colored by score, and the best landings flown there. Land a great one and it's on the board.
- Top landings per airport, with medals for the best.
- A fresh board every 90 days — a winnable slot each quarter, even where the all-time record is locked up, with an email when someone bumps your best off it.
- Your standing when you're just off the top — the percentile you're in and who's just ahead to chase.
- Anonymous by default — show your name on the board only if you choose to.
- 13,976 airports covered across United States, Australia, Europe, South Africa, Namibia, New Zealand and Canada, with runway-level detail.
Maps & charts
See the whole flight, not just the score
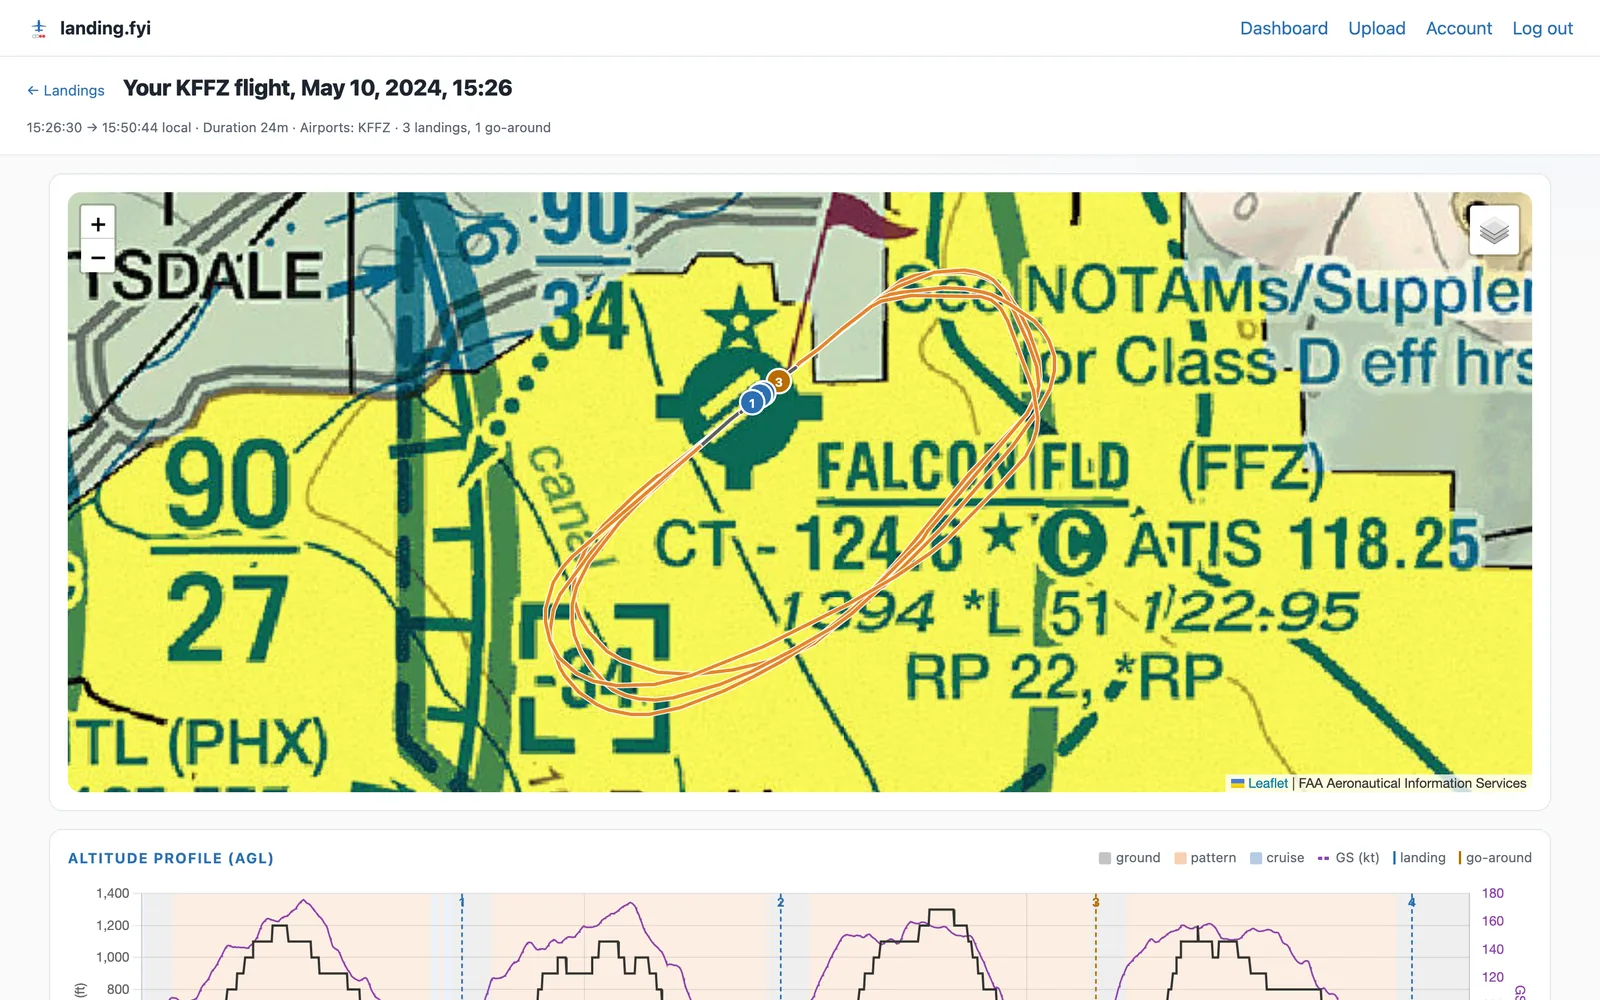
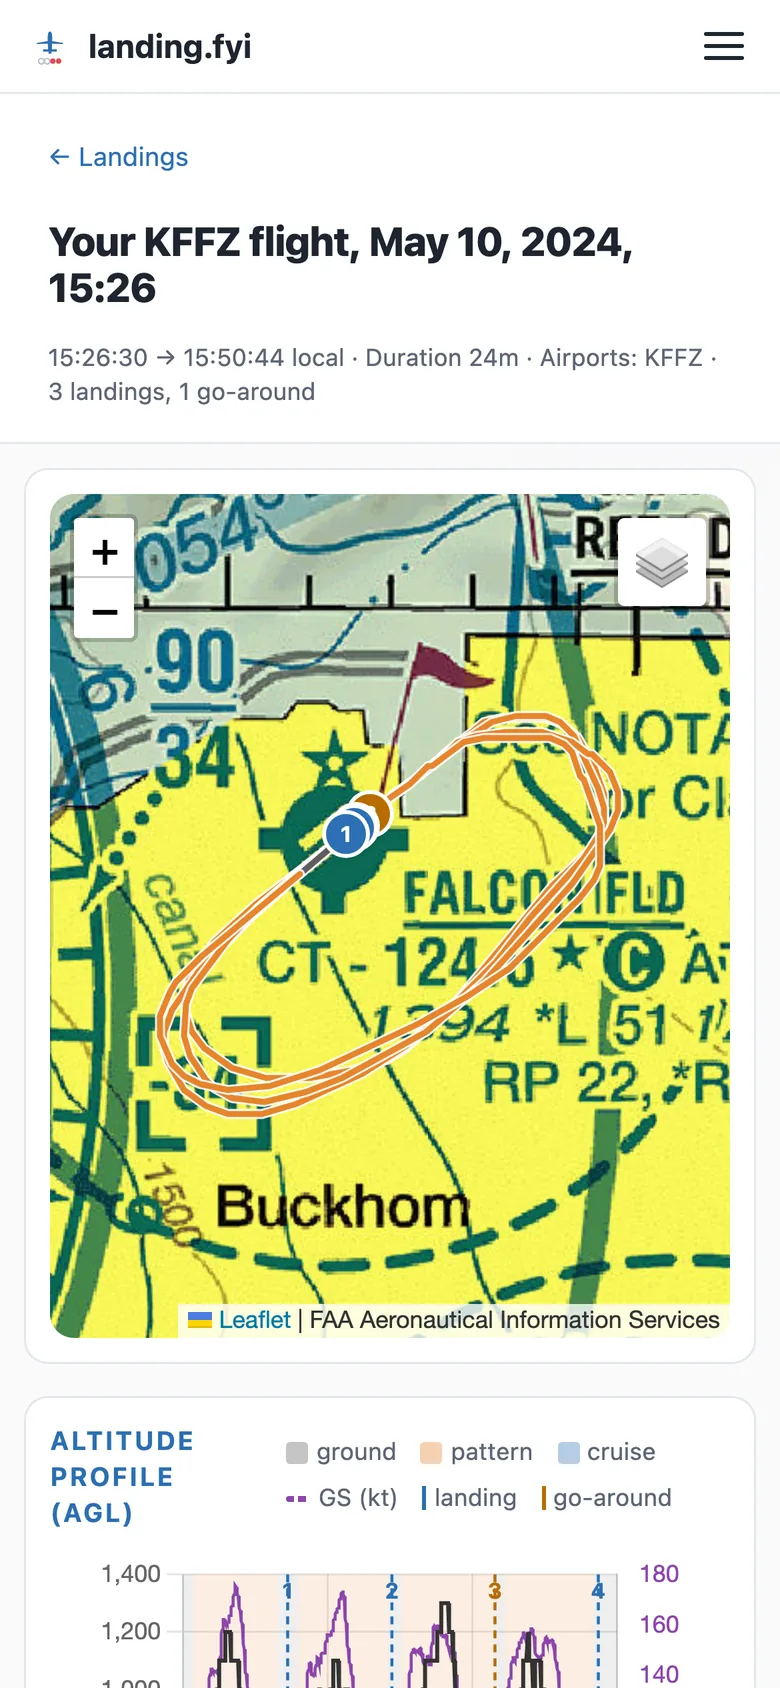
Every flight renders on an aviation chart with each touchdown and go-around marked, and every landing gets an approach profile — airspeed, altitude, and descent rate down final, with the pattern legs picked out.
- Touchdown map — where you touched relative to the threshold and centerline, with a wind diagram at the moment of touchdown.
- Approach chart per landing — airspeed, ground speed, altitude, and descent rate on one timeline.
- Wind on final — headwind and crosswind resolved per landing, estimated when your panel doesn't record wind.
- Density altitude and temperature — on every landing, from your avionics when it logs temperature, otherwise from the nearest weather station at the time you landed.
Share & privacy
Private by default, shareable on demand
- Everything is private to your account out of the box.
- Per-landing share pages — score card, map, and approach chart, each behind its own revocable link.
- You pick what shows — tail number, aircraft, your name, the date: every field is an explicit toggle, all off-by-default except the date.
- Share your season — one link for your whole stats card, if you want the bragging rights.
- A night sky for a night landing — share a landing flown after dark and its card gets a starry sky; a dusk landing gets a sunset glow.
- Install it like an app — from Chrome or Edge on your computer, or Add to Home Screen on your phone, landing.fyi opens in its own window, straight to your dashboard.
- Auto-import — point your data pipeline at the API and landings appear on their own.
Works with your avionics
No panel log? A ForeFlight or Garmin Pilot track, or a GDL 50, still scores 4 of the 6 parts, marked low-confidence so it stays off the leaderboards.
See setup & export guides for every device →Ready to score a landing?
Create an account and upload your first log.