 landing.fyi
Your own takeoff and landing distances, a cockpit replay of every landing, and every map in 3D
Performance is here: landing.fyi now works out your takeoff and landing distances for any airport and time, learned from your own flights and drawn on the runway. Pilot view flies any landing again from the cockpit over real terrain, every map has a 3D switch, and a landing you share tells the whole story.
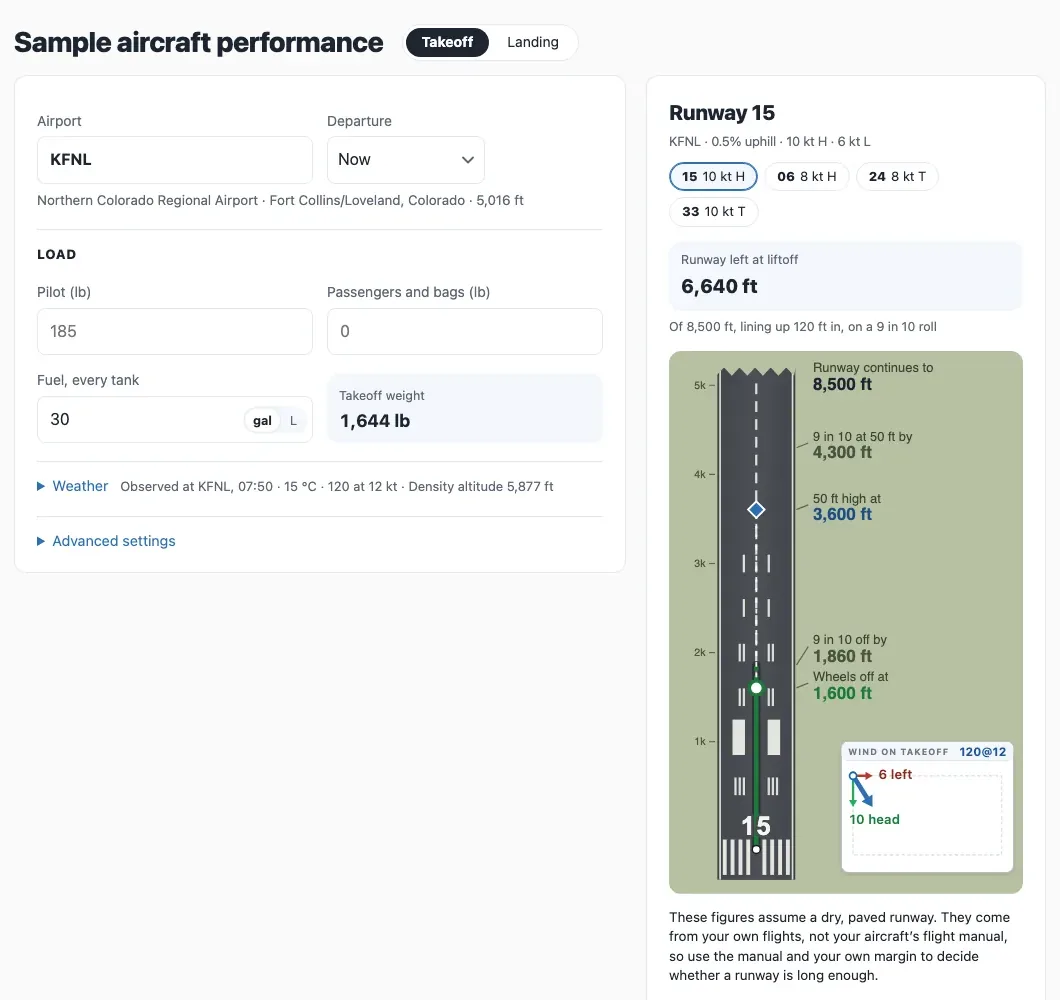
Performance: your own takeoff and landing distances
Pick an airport and a time and see your takeoff roll, the distance to clear 50 ft and your landing distance, drawn on the runway for your load. At US airports the current weather, or the forecast for a time ahead, fills in by itself; change any of it to try other conditions, or type in your own anywhere. The figures are learned from your own flights and sized to cover 9 in 10 of them. They're estimates, not the flight manual: the manual and your own margin still decide. It opens for your aircraft once you've logged about 30 takeoffs and 50 landings; anyone can try it on a sample aircraft.
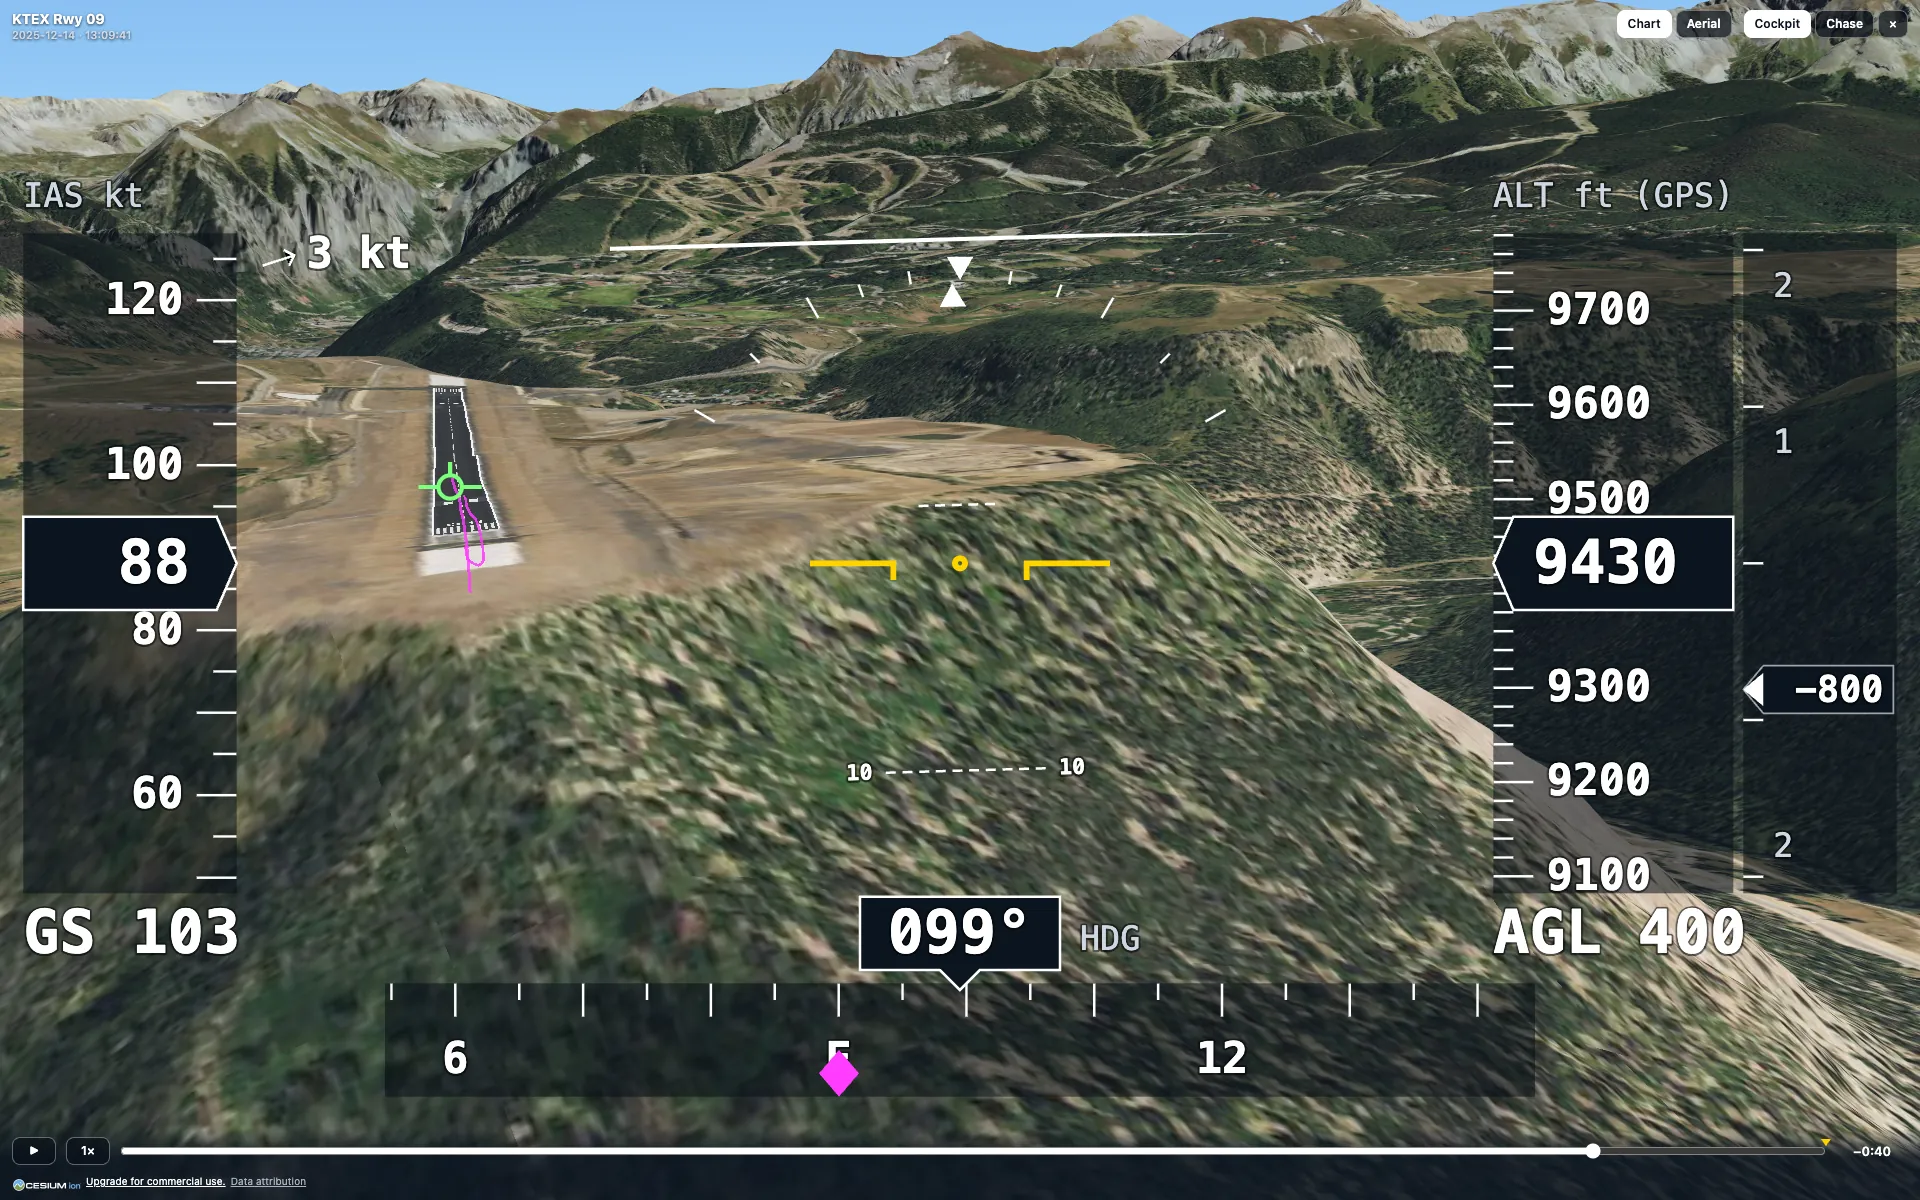
Pilot view: fly it again
Every landing has a Pilot view button: a cockpit view over 3D terrain with the runway drawn in, aerial imagery under the approach in the US, your airspeed, altitude, vertical speed and heading on live tapes, a flight-path marker and the wind. Play it at real speed or faster, drag to any moment, or switch to a chase view. The whole-flight page flies the entire trip.
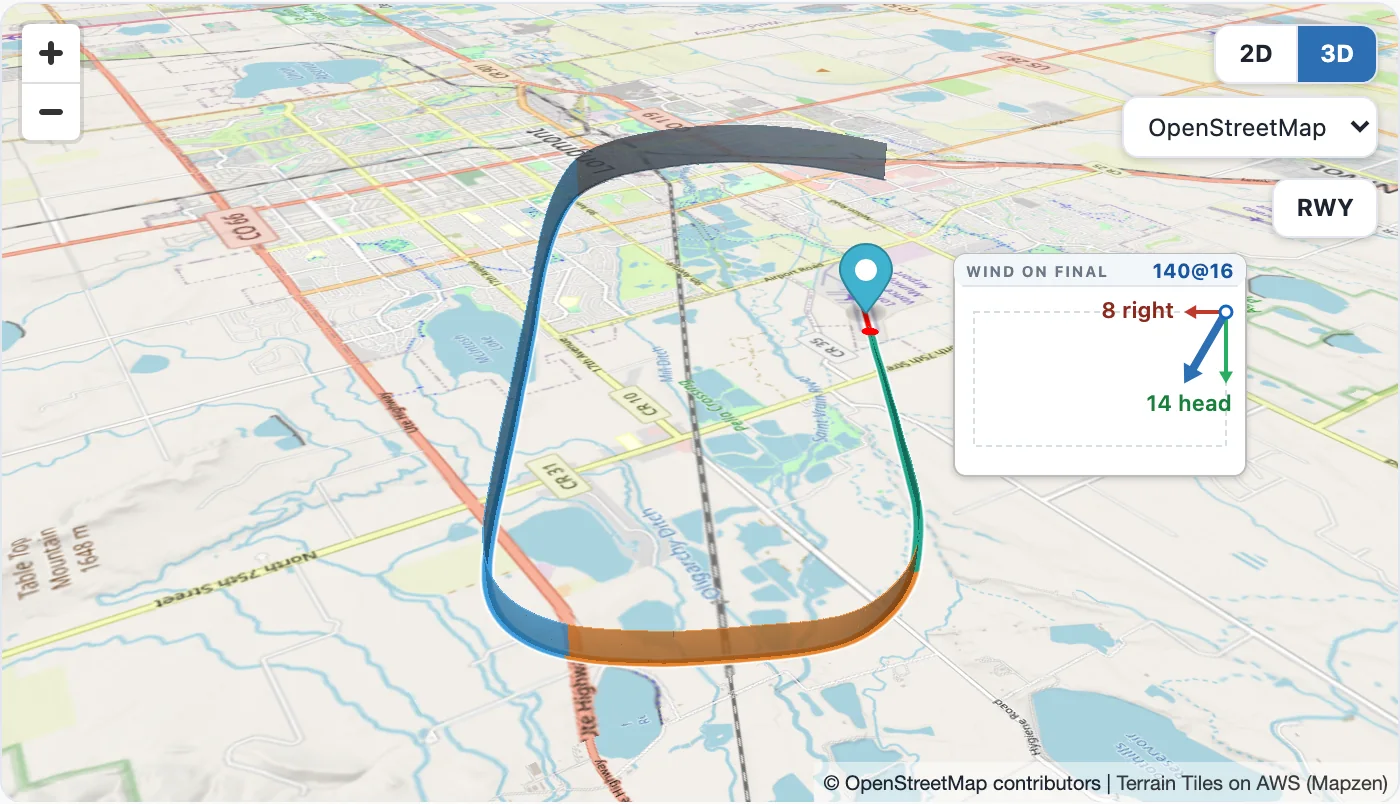
Every map in 3D
The maps on your landings, the whole-flight page, a shared landing and an airport's page have a 2D / 3D switch. In 3D the terrain rises under the map and your track stands above it at the height you flew, from the approach down to the touchdown.
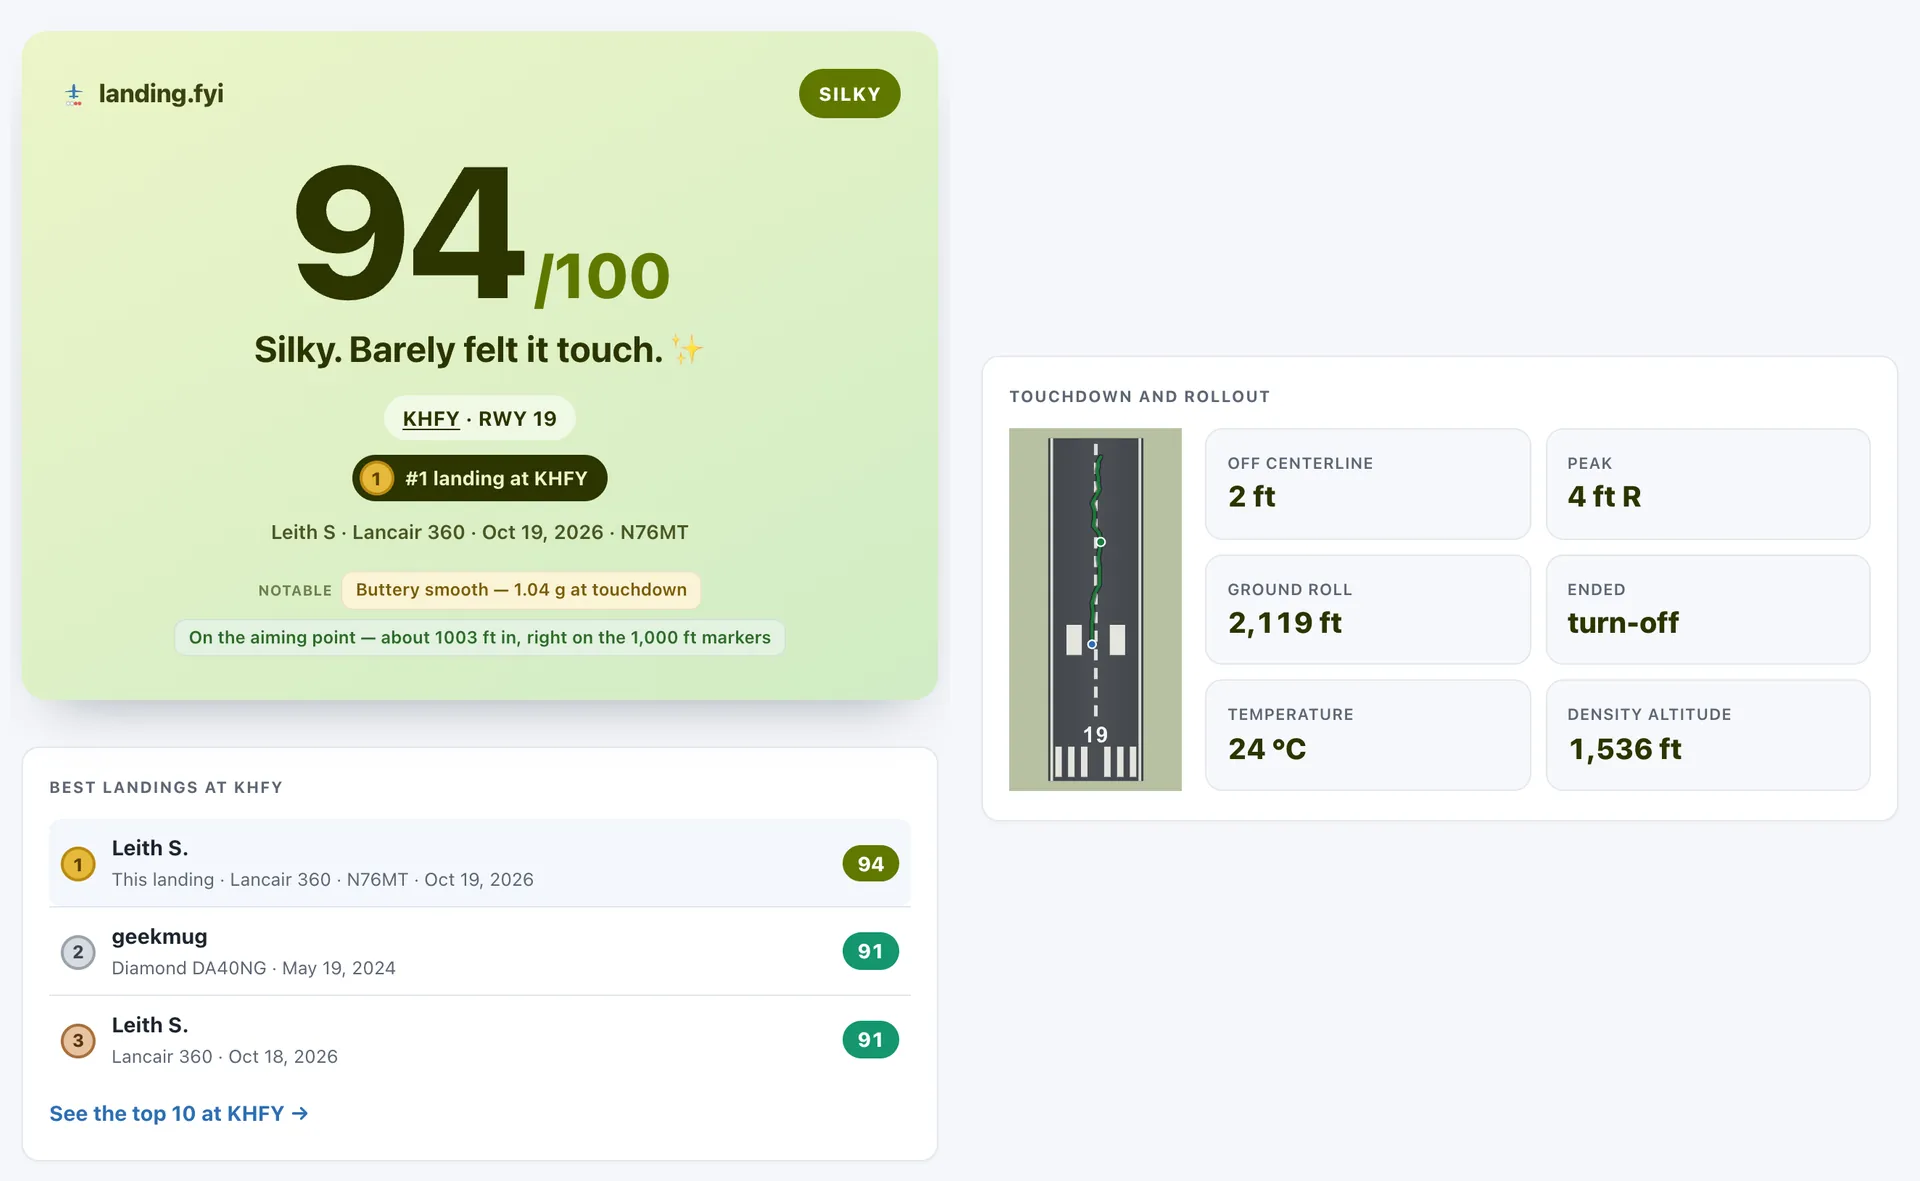
Shares that tell the whole story
A landing you share now shows its rollout on the runway, the temperature and density altitude at touchdown, and where it ranks at that airport, like "#1 landing at KHFY", with the airport's top three and a link to its top 10.
November is the month landing.fyi starts looking ahead as well as back
Every landing you've uploaded has been teaching landing.fyi how your aircraft performs the way you fly it, and this month that turns into a new Performance tab. Pick an airport and a time and it works out your takeoff roll, your liftoff speed and the distance to clear 50 ft, or for a landing the distance from 50 ft over the threshold, where you touch down, and where you stop with your regular braking and with the hardest you've braked before. It's all drawn on the runway: where the wheels come off, where you're 50 ft up, where you stop, and how much runway is left. Every runway end is listed with its headwind or tailwind and its slope, so you can see which one works. The figures are sized to cover 9 in 10 of your own flights, not just your average one.
At US airports the weather fills itself in: the latest report for now, or the hourly forecast for a time ahead. Change any of it, or type in your own anywhere, to see what a hot afternoon or a gusty crosswind does to the numbers. The density altitude is worked out for you. Tell it your load (you, passengers, bags and fuel) and it scales the numbers to the weight. When you first open it, a short setup asks about your aircraft and who was aboard on a few of your past flights, and from those answers it learns what weight does to your takeoff.
These are estimates from your own flights, not your aircraft's flight manual, and they assume a dry, paved runway. Use the manual and your own margin to decide whether a runway is long enough.
Performance is opening to pilots with enough flying logged: about 30 takeoffs and 50 landings over 10 or more days. If you're there, you'll find Performance in the bar at the top of your dashboard. If you're not there yet, keep uploading, and in the meantime try it on a sample aircraft at landing.fyi/demo/performance: any airport, every setting, and live weather at US airports.
Pilot view is a button on every landing's card, and on the whole-flight page for the entire flight. It opens a cockpit view over 3D terrain with the runway drawn in, and plays your approach back at real speed: airspeed, altitude, vertical speed and heading on their own tapes, a flight-path marker showing where the aircraft was actually going, the wind, and your height above the ground. Speed it up, drag back to the moment the sink started, or switch to a chase view to watch the aircraft from behind. In the US, aerial imagery takes over from the chart as you come down, so on short final you see the runway and the fields around it the way they look from the cockpit. Where your avionics log pitch, bank and heading it flies them as logged; where they don't, it flies the aircraft along your GPS path and says so on the display.
The maps went 3D too. The map on each landing, the whole-flight page, a shared landing and an airport's page all have a 2D / 3D switch. In 3D the terrain rises under the map and your track stands above it at the height you flew, with a curtain down to the ground so you can read how high you were over each field and ridge. Tilt and turn it to see the approach the way you flew it. Around the busier US terminal areas the maps now draw the FAA Terminal Area Chart, with twice the sectional's detail, and as you zoom in close or come down low the chart fades over a street map, so roads, fields and water stay sharp under the airspace.
A shared landing now tells the whole story. Its page shows the rollout on the same runway drawing as your dashboard, and the temperature and density altitude at touchdown under the wind on final. If you're on the airport's board, the card and the page say where the landing ranks there, like "#1 landing at KHFY", with a medal on a podium finish, and the page lists the airport's top three with a link to its top 10. It only shows a place on the top 10, never how many landings the airport has. Go get that medal at your home field and send it to someone!
A few more things while we were at it. When your avionics log no wind and have no temperature probe, more of them now get an estimated wind on final, marked with a ~, worked out from your heading, airspeed and GPS track. And log files are compressed before they upload, so a log holding months of flights (up to 100 MB) goes up in one go, and a log that was opened and saved again in a spreadsheet app is still read.
More of the world's runways now come straight from official aeronautical data: France, Switzerland, Finland, the Netherlands, Austria, Iceland, Gibraltar, New Zealand and the UK's military airfields. Kazakhstan (31 airports) and Georgia (13) are new countries this month, and more than 30 more airfields elsewhere can now be scored, from Montricher and Gjögur to Middle Wallop and Netheravon.