 landing.fyi
Your landing index, a monthly recap, and your progress on the dashboard
This month is all about watching yourself get better: a single landing index to move like a golf handicap, a shareable recap of every month you fly, and streaks, personal bests and trends right on your dashboard — plus a fresh board to win at your airports each quarter.
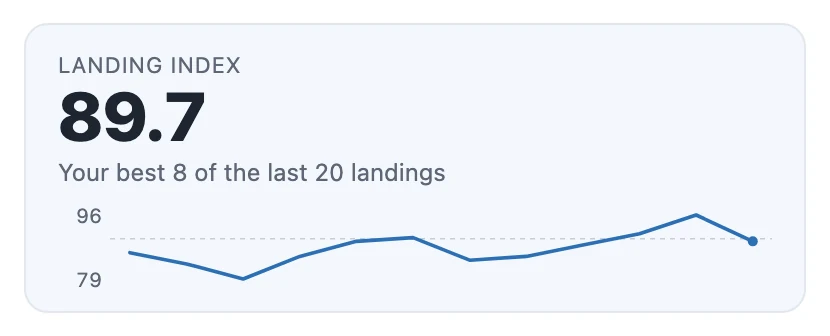
Your landing index
One number that sums up how you're flying right now — the average of your best 8 of your last 20 landings, golf-handicap style. It rewards a good run and shrugs off a single rough day, so it's the number to watch climb as you get better. Front and centre on your dashboard.
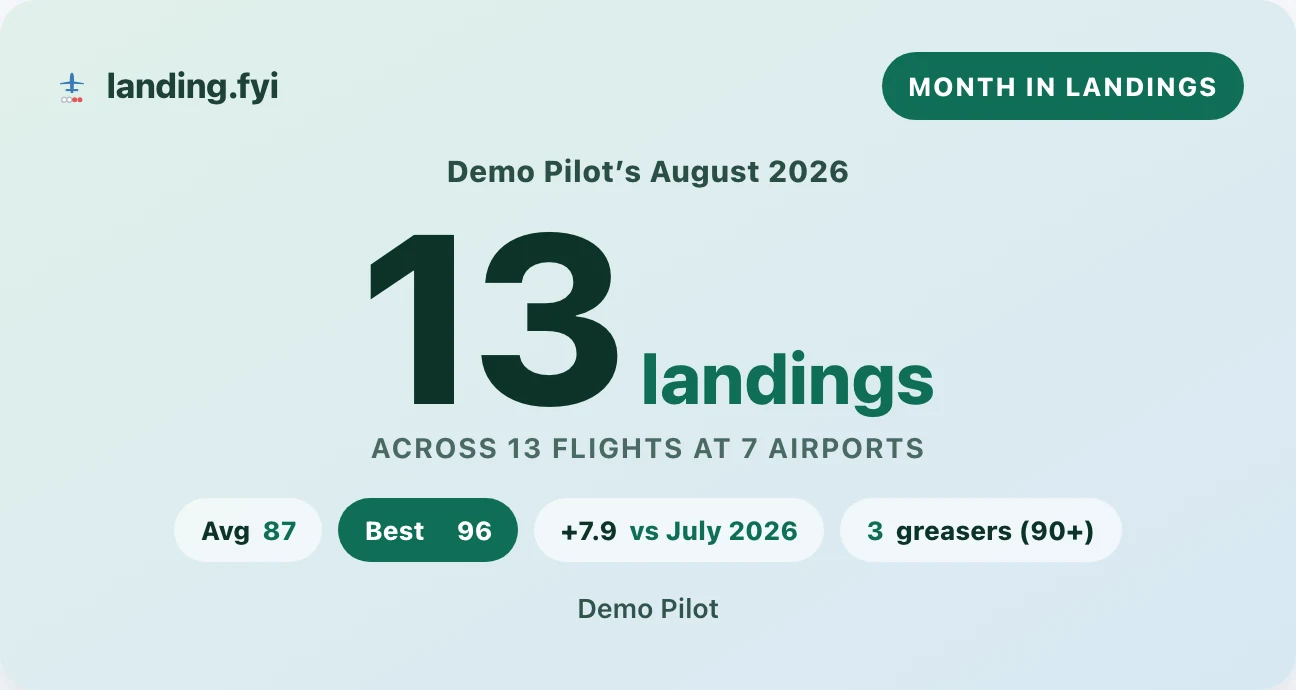
A recap of every month you fly
A shareable month-in-review lands about a week into the following month: your total landings, airports and new fields, your average and your best, how you improved on last month, and your signature moments — greasers, biggest crosswind handled, gust re-lifts. There's a Year in Landings too, all under Your account → Your recaps.
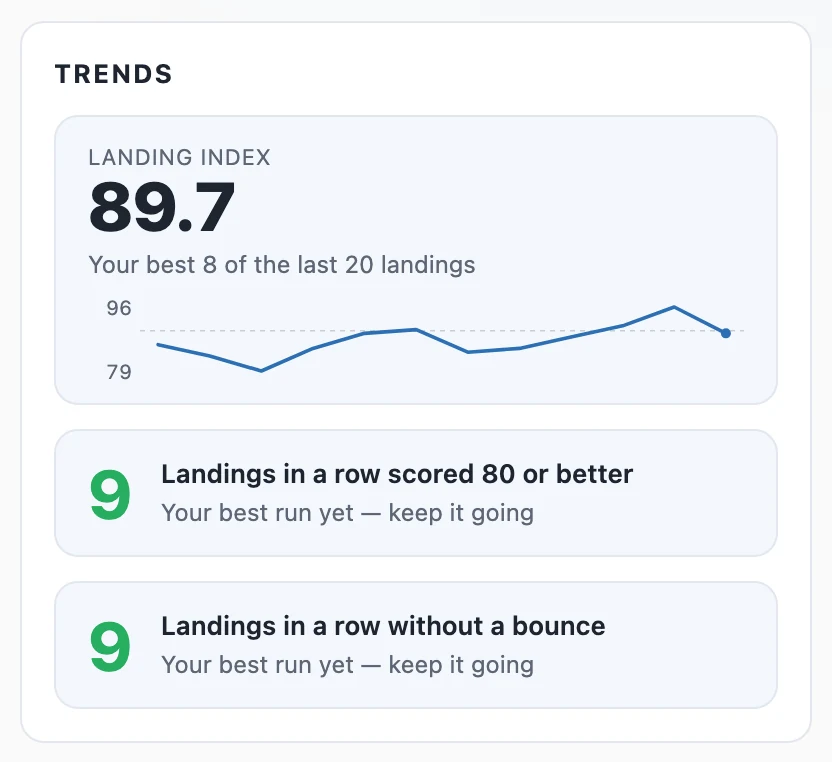
Streaks, bests and trends on your dashboard
Your dashboard now shows you improving. See the run you're on — landings in a row at 80 or better and in a row without a bounce, with a personal best to beat. When a touchdown is your best ever, or your best at a field, the card calls it out. And a new panel charts each part of your score over time, so you can see what's improving and what to work on next.
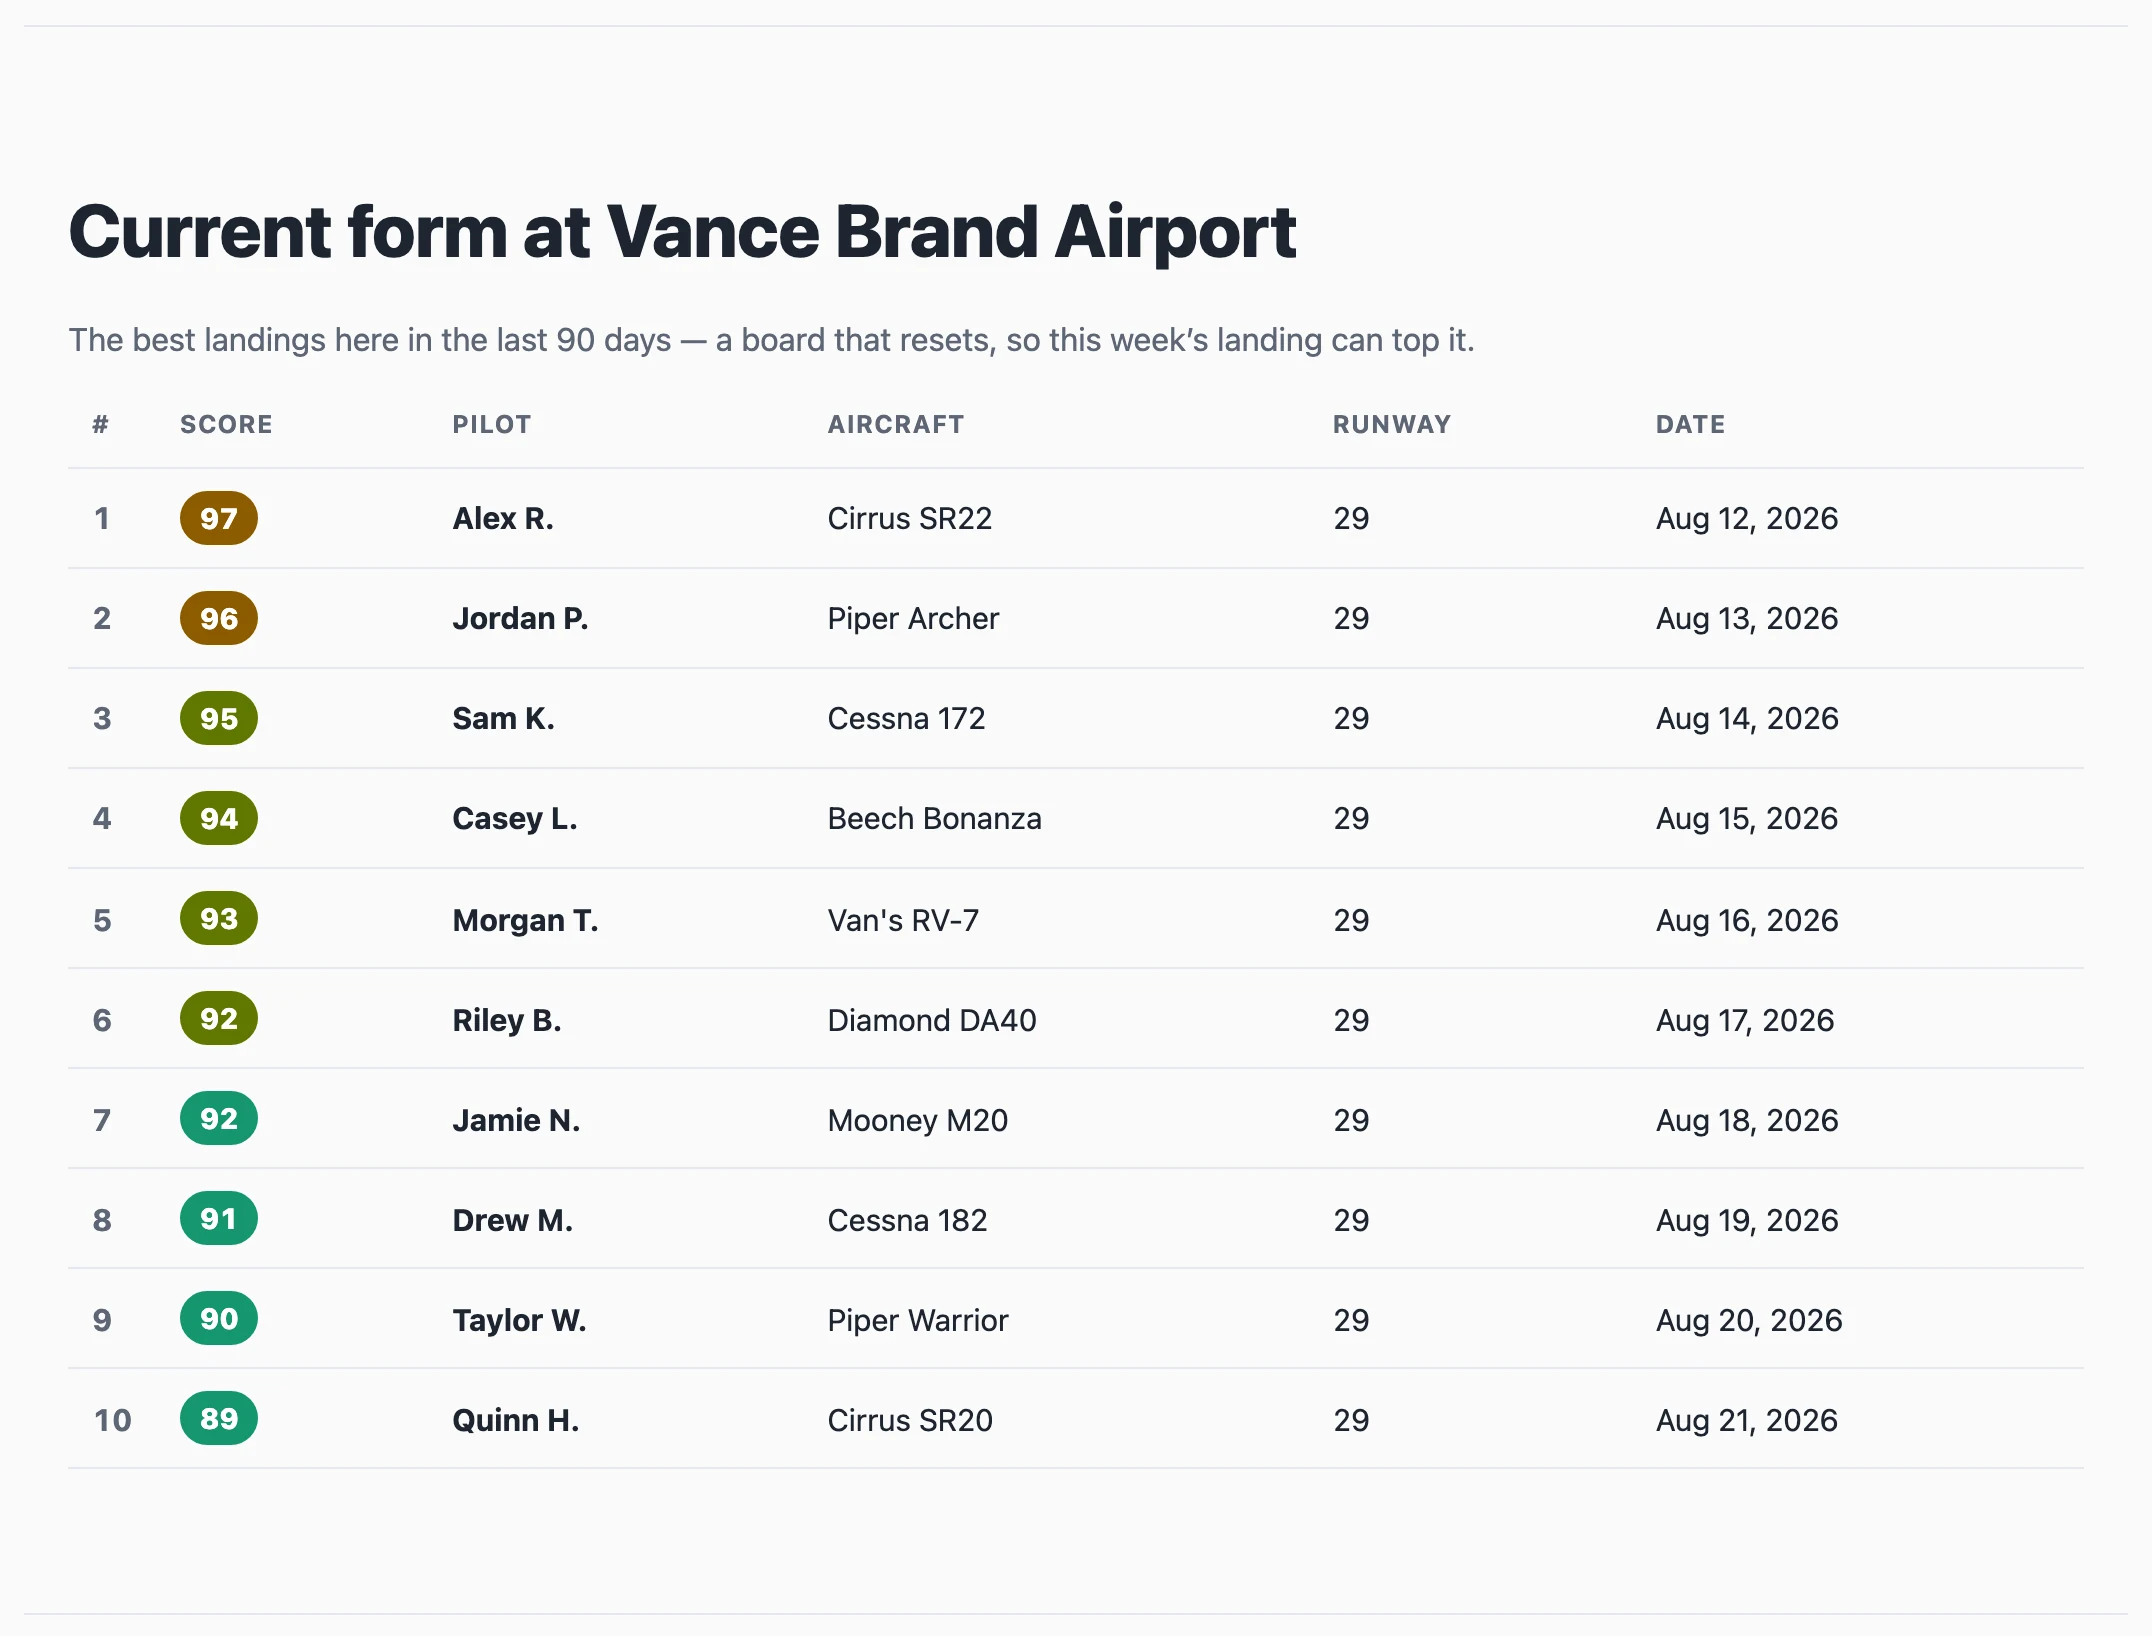
A fresh board every quarter — and defend your spot
Every airport page now has a last-90-days board beside the all-time best, so there's a winnable board each quarter even where the record is locked up. If your best sits just outside the top 10, you'll see your percentile and who's just ahead. And you'll get an email the moment another pilot bumps your best off a board — so you know when to go defend it.
September is all about watching your numbers climb
The headline is your landing index — one number, golf-handicap style, that tells you how you're flying right now. It's the average of your best 8 of your last 20 landings, so it rewards a good run and barely moves on a single rough day. It sits front and centre on your dashboard, and it's the number to watch climb as you get better.
Every month you fly now gets a recap. About a week into the next month a shareable month-in-review lands — your total landings, airports and new fields visited, your average and your best, how you improved on last month, and your signature moments: greasers, biggest crosswind handled, gust re-lifts. There's an annual Year in Landings too, and you'll find them all under Your account → Your recaps.
Your dashboard got a lot more about progress. It shows the streak you're on — touchdowns in a row scored 80 or better, and in a row without a bounce, with a personal best to beat (counted in landings, so time off flying never breaks it). When a landing is your best score ever, or your best at a field you've flown before, the card says so. And a new set of charts tracks each part of your score — firmness, flare, airspeed, descent rate, alignment, rollout — over time, so you can see exactly what's coming good and what to work on next.
There's a fresh challenge at your airports, too. Alongside the all-time best, every airport page now carries a last-90-days board — a winnable slot every quarter even where the all-time record is locked up. If your best there sits just outside the top 10, a new panel shows your percentile and the pilots a point or two ahead to chase down. And the moment another pilot's landing bumps your best off a board, we'll email you — so you know exactly when it's time to go fly it again.
A few smaller things while we were at it: your rollout — the runway diagram of how you tracked the centreline — now sits right in the landing card instead of behind a click; a shared landing carries its notable moments onto the preview image and share page; a landing's map opens framed on the runway and your last few miles of final; and a bounced landing shows the stretch of runway it happened on, marked on the rollout diagram.